


Introduction
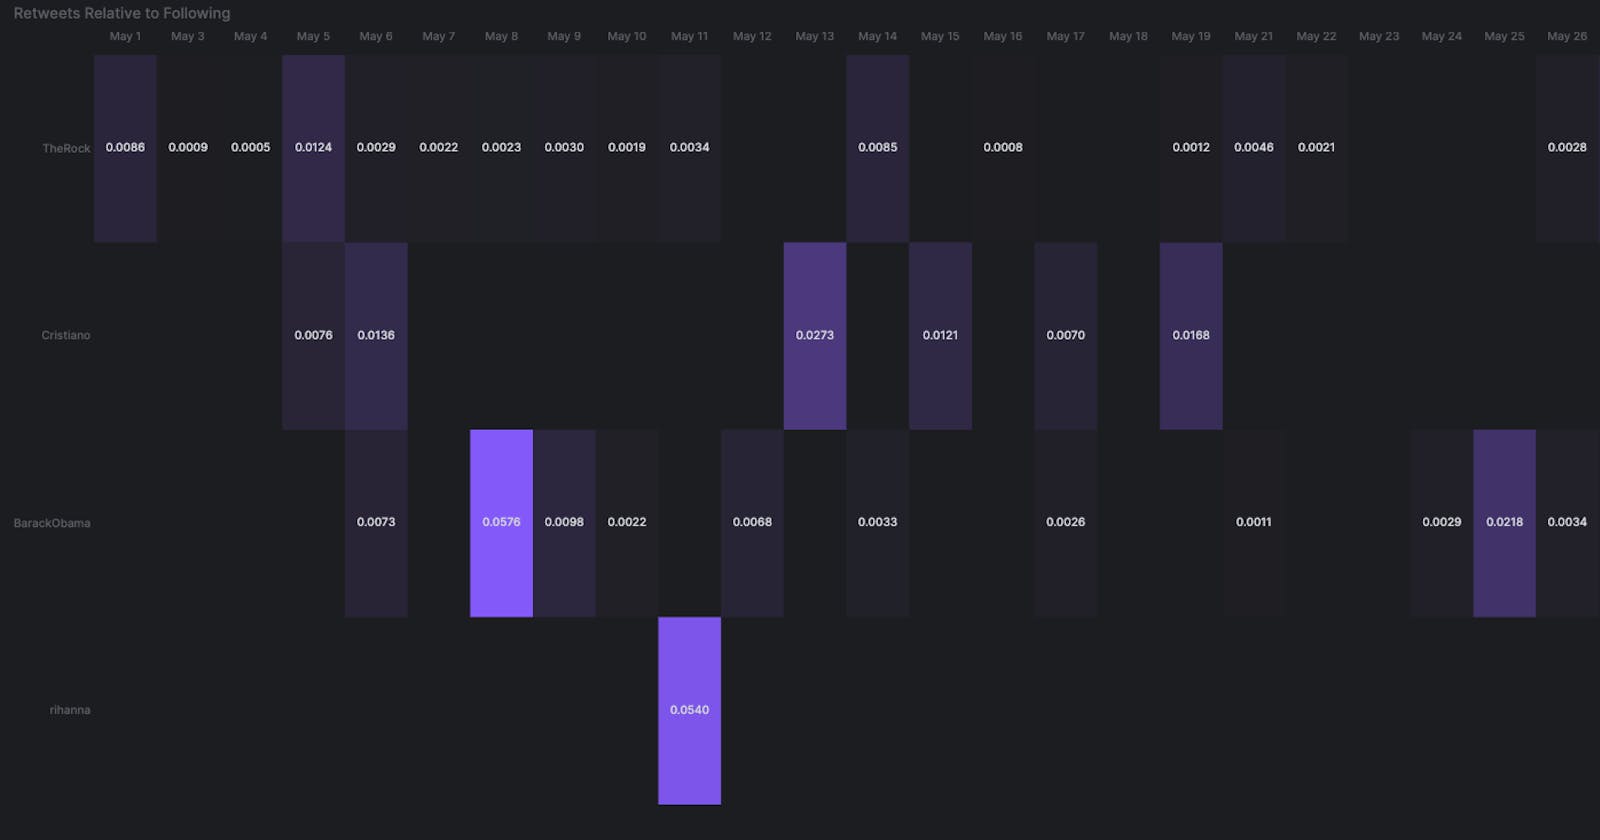
In this tutorial, we will learn how to manage tweet activity using the official Twitter API and generate a heat map from tweets using Arctype. To achieve this, we will be tracking some very popular celebrities’ tweets to create a heatmap like the one in the image above.
Prerequisites
To fully understand this tutorial, you should have the following:
- Python 3.7 or newer.
- Arctype
- Basic understanding of SQL.
- Basic understanding of Django.
- A Twitter developer account.
- A text editor.
Setting up the Twitter API
To make use of the Twitter official API, you need to set up your Twitter developer account. Go to https://developer.twitter.com and signup if you haven’t. To sign up, you will need to provide detailed information on how you want to utilize your access to the Twitter API. After providing the information, you will need to wait for Twitter to verify and enable your account.

At this point, you need to create a project which can house multiple applications. First, click on create project, then give your project a name, use case, and a description.


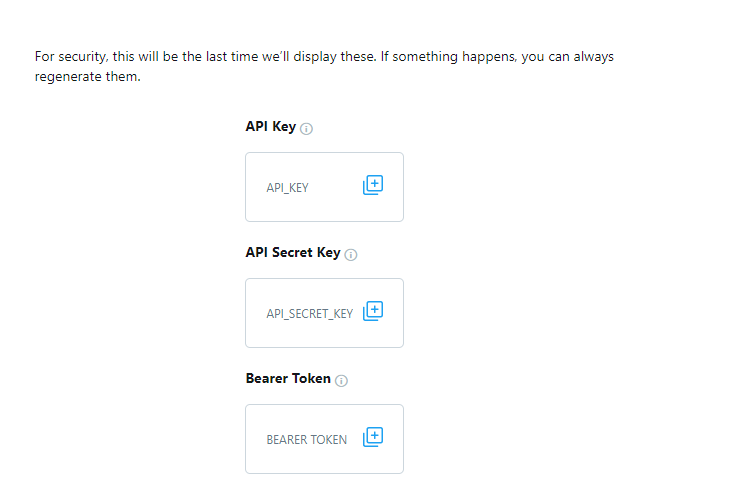
access token and access secret token for your application at the bottom of the page displayed.
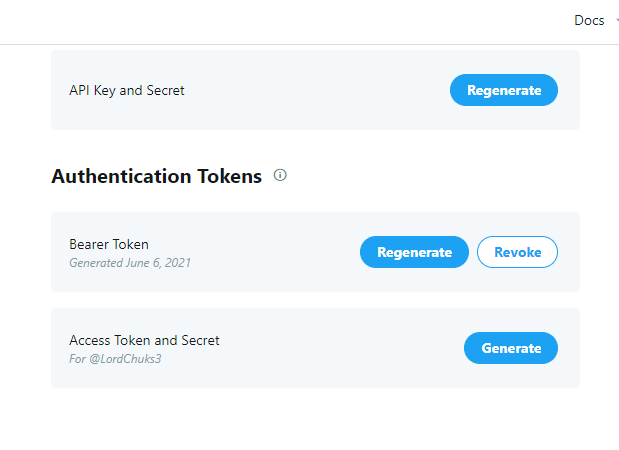
access_token and access_secret_token somewhere you can easily retrieve them.
Creating a Django Application
To create the Django application, run the following code in your command line:
    # creating the project
    python manage.py startproject TweetsDaily

    # change to the project directory
    cd TweetsDaily

    # creating the app
    python manage.py startapp App
Now, go to the settings.py file and App to the list of installed apps as seen below:
    INSTALLED_APPS = [
    'django.contrib.admin',
    'django.contrib.auth',
    'django.contrib.contenttypes',
    'django.contrib.sessions',
    'django.contrib.messages',
    'django.contrib.staticfiles',
    'App'
    ]
Next, go to the urls.py file in the project directory and edit as seen in the code below:
    from django.contrib import admin
    from django.urls import path, include
    from django.conf import settings
    urlpatterns = [
    path('admin/', admin.site.urls),
    path('', include("App.urls")),
    ]
Finally, go to the App folder and create a new urls.py file. Add the python code below to the file and save:
    from django.conf import settings
    from django.conf.urls.static import static
    from django.urls import path, include
    from . import views
    app_name = "App"
    urlpatterns = [
    path("", views.index, name="index"),
    ]
In the code above, we defined the index URL and connected it to the index view, which we will define in our views.py file.
Building Django Data Models
Here we will define the table models in the models.py file as see in the python code below:
    from django.db import models

    # Create your models here.
    from django.db import models

    # Create your models here.
    class Tweets(models.Model):
    username= models.TextField()
    tweet_number = models.IntegerField()
    created_at = models.IntegerField()
    time = models.IntegerField()
    retweet_count= models.IntegerField()
    def __str__(self):
    return self.tweet_number
After saving, we need to migrate the database using the below command in the project directory.
    #making migrations
    python manage.py makemigrations

    #migrating the database
    python manage.py migrate
Writing Django Views
The views.py file in the Django project is where we write the main logic for the application.
Importing the Required Libraries
Copy and paste the python code below at the top of the views.py file to import the required libraries.
    from django.shortcuts import render
    from tweepy import OAuthHandler
    from tweepy import API
    from tweepy import Cursor
    from datetime import datetime, date, time, timedelta
    from collections import Counter
    from django.http import HttpResponse
    from . models import Tweets
Initializing Tweepy
Copy and paste the code below in the views.py file and provide your real keys to initialize Tweepy.
    consumer_key="api_key"
    consumer_secret="api_secret_key"
    access_token="access_token"
    access_token_secret="access_token_secret"
    auth = OAuthHandler(consumer_key, consumer_secret)
    auth.set_access_token(access_token, access_token_secret)
    auth_api = API(auth,wait_on_rate_limit=True)
We also need to create a list of the usernames of all celebrities whose tweets we want to analyze, as seen in the code below.
username=["Cristiano","BarackObama","rihanna","TheRock"]
Creating the Index View
Copy and paste the python code below in the views.py file to build the index view. This view is triggered by loading the application in the browser:
    def index(request):
    tweet_count = 0
    for i in username:
    try:
    for status in Cursor(auth_api.user_timeline, id=i).items():
    tweet_count = tweet_count + 1
    if status.created_at.year == 2021 and status.created_at.month == 5:
    tweets_save= Tweets.objects.create(username=i,tweet_number=tweet_count,created_at=status.created_at.day,time=status.created_at.hour,retweet_count=status.retweet_count)
    tweets_save.save()
    except:
    pass
    return HttpResponse('<h1>Loaded Tweets Data</h1>')
In the code above, we are making a request to the Twitter API using Tweepy to retrieve all the user’s tweets. We are now running a loop through the user’s tweets to check for all the tweets made in May 2021. Finally, we will save all the tweets and the number of times the user’s followers retweeted them to the database. The applications will then send an HttpResponse “Loaded Tweets Data” to the application when run.
To run your application, copy and paste the below commands in your command line’s project directory:
    #running the application
    python manage.py runserver
if the application is running, you should see the result as seen below:
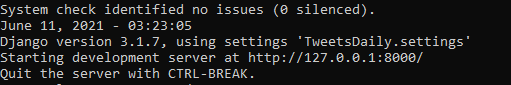
index view to save all the tweet data in the database.
Connecting Arctype to a MySQL Database
To make use of Arctype, we need to connect our database and set up a workspace. To do this, follow the instructions below.
Step 1
Open Arctype, click on “I have an existing database” and select your database type. For this tutorial, we are using MySQL.
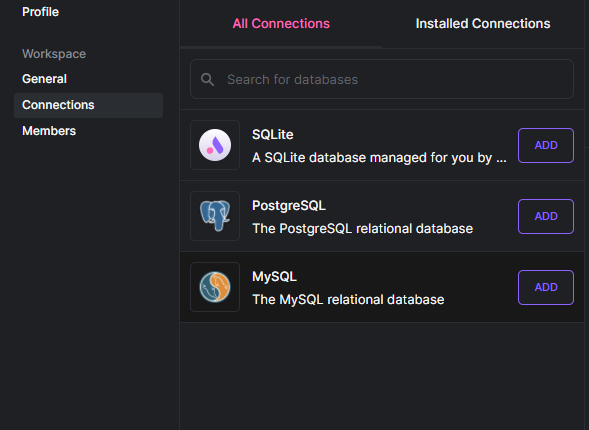
Provide the required information for the database and click Save.

You should now see the database in Arctype. Next, go to the Tweets table. You should have something similar to the image below.

Compare Retweets between Accounts Using MySQL
We currently have multiple tweet data for May in the year 2021 saved in the Tweet table. To make a heat map of the data, we need to sum up the retweet count for the tweets created each day in the month of may and group all the tweets that the user’s followers retweeted by the date and username. In addition, because Barack Obama and Rihanna are two of the most-followed people on Twitter, we should factor in the size of each account's following to get a clearer picture in our data.
To achieve this, click on the new query button, then save and run the SQL query below:
    SELECT
      username,
      (
        CASE
          WHEN (username = 'rihanna')
              THEN (SUM(retweet_count) / 102300000 * 100)
          WHEN (username = 'BarackObama')
              THEN (SUM(retweet_count) / 129600000 * 100)
          WHEN (username = 'TheRock')
              THEN (SUM(retweet_count) / 15200000 * 100)
          WHEN (username = 'Cristiano')
              THEN (SUM(retweet_count) / 92400000 * 100)
        END
      ) AS tweet_heat,
      CONCAT('May ', created_at)
    FROM
      app_tweets
    GROUP BY
      created_at,
      username
    ORDER BY
      created_at ASC
Running the code above will provide you with data, as seen in the image below.

Build a Twitter Heat Map Chart in Arctype
To create a heat map chart for the tweet data above, follow the instructions below:
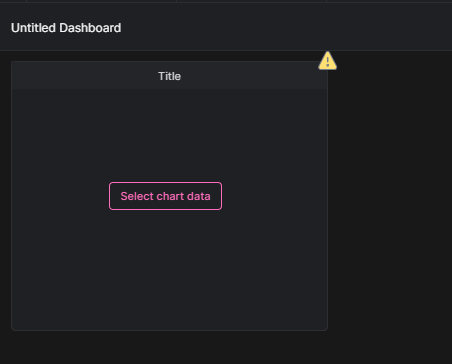
Create a New Arctype Dashboard
Create a new tab, then select the New Dashboard button in the top menu. Then, click on the + Add button, then select ‘chart.’
Get Chart Data from a Saved Query
Click on Select Chart Data on the blank dashboard provided.
Assign Result Columns to Heat Map Axes
Select ‘Heat map’ as chart type, then drag and drop data arranged as seen in the image below.

Customizing an Arctype Heat Map
Finally, go to the advanced tab, then enter “Retweets Per Day” as the y-axis value.
After following the above instructions, you should have a heat map similar to the one in the image below.
 The heat map above displays the retweets activity for every tweet made by the four celebrities in May 2021 grouped by the day the celebrity created the tweet.
Other Heat Map Examples
Visualizing User Tweets
Create a new query with the SQL query below. Then, run and save the query.
    WITH alldates AS(
      SELECT
        distinct created_at
      FROM
        app_tweets
      ORDER BY
        1
    ),
    alltimes AS(
      SELECT
        distinct time
      FROM
        app_tweets
      ORDER BY
        1
    ),
    timetable AS(
      SELECT
        *
      FROM
        alldates,
        alltimes
      ORDER BY
        1
    )
    SELECT
      CONCAT('May ',t.created_at) AS day,
      CONCAT(t.time,':00') AS hour,
      COUNT(a.tweet_number) as tweets
    FROM
      timetable t
    LEFT OUTER JOIN app_tweets a ON (a.username = 'BarackObama' AND a.created_at = t.created_at AND a.time = t.time)
    GROUP BY t.time, t.created_at
    ORDER BY t.created_at, t.time
Create a new heat map chart using the query data you saved above. Then, configure the heat map to have the day field in the x-axis, hourin the y-axis, and the tweets in the z-axis.
 The heat map above displays every tweet made by one of the celebrities (i.e., Barack Obama) in May 2021, grouped by the day and the hour of the day the user created the tweet.
Querying for a Twitter User's Retweets
Create a new query with the SQL query below. Then, run and save the query.
    WITH alldates AS(
      SELECT
        distinct created_at
      FROM
        app_tweets
      ORDER BY
        1
    ),
    alltimes AS(
      SELECT
        distinct time
      FROM
        app_tweets
      ORDER BY
        1
    ),
    timetable AS(
      SELECT
        *
      FROM
        alldates,
        alltimes
      ORDER BY
        1
    )
    SELECT
      CONCAT('May ',t.created_at) AS day,
      CONCAT(t.time,':00') AS hour,
      SUM(a.retweet_count) as retweets
    FROM
      timetable t
    LEFT OUTER JOIN app_tweets a ON (a.username = 'BarackObama' AND a.created_at = t.created_at AND a.time = t.time)
    GROUP BY t.time, t.created_at
    ORDER BY t.created_at, t.time
Create a new heat map chart using the query data you saved above. Then, configure the heat map to have the day field in the x-axis, hour in the y-axis, and the retweets in the z-axis.
 The heat map above displays the retweets activity for every tweet made by one of the celebrities (i.e., Barack Obama) in May 2021, grouped by the day and the hour of the day the user created the tweet.
Visualize Tweets-Retweets Ratio
Create a new query with the SQL query below. Then, run and save the query:
    WITH alldates AS(
      SELECT
        distinct created_at
      FROM
        app_tweets
      ORDER BY
        1
    ),
    alltimes AS(
      SELECT
        distinct time
      FROM
        app_tweets
      ORDER BY
        1
    ),
    timetable AS(
      SELECT
        *
      FROM
        alldates,
        alltimes
      ORDER BY
        1
    )
    SELECT
      CONCAT('May ',t.created_at) AS day,
      CONCAT(t.time,':00') AS hour,
      CAST((SUM(a.retweet_count)/COUNT(tweet_number)) AS UNSIGNED) as ratio
    FROM
      timetable t
    LEFT OUTER JOIN app_tweets a ON (a.username = 'BarackObama' AND a.created_at = t.created_at AND a.time = t.time)
    GROUP BY t.time, t.created_at
    ORDER BY t.created_at, t.time
Create a new heat map chart using the query data you saved above. Then, configure the heat map to have the day field in the x-axis, hour in the y-axis, and the ratio in the z-axis.

Conclusion
In this article, you learned how to track tweet data with Tweepy and visualize them as a heat map on a dashboard with Arctype. In addition, you saw how easy it is to run SQL queries on your database using Arctype and got the chance to explore some of its core features and functionalities.
The source code of the dashboard application and the links to the Arctype SQL dashboard are available on Github. If you have any questions, don't hesitate to contact me on Twitter: @LordChuks3.