


In this tutorial, we'll first build a simple to-do app in Django using Python. Then we'll explore some ways we can visualize the resulting data in our database client. Want to build an analytics dashboard or twitter scraper instead? Check out these previous tutorials:
Prerequisites
To fully understand this tutorial, you will need the following:
- Python 3.8 or newer
- A basic understanding of Django 3.0 or newer
- An IDE (PyCharm, VS Code).
- A SQL client like Arctype
- Basic working knowledge of SQL
Python setup
Installing Python
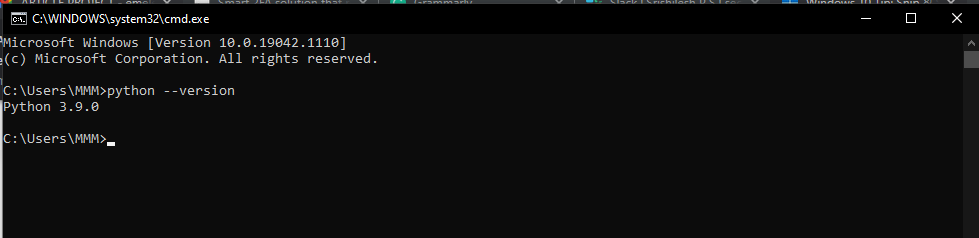
First, let's install Python using this link. Then, we can select our OS and download it. This tutorial was built on Windows. We can run the command Python --version to check if Python is successfully installed on our system. If Python is installed, we get a response as shown below:
Creating a virtual environment
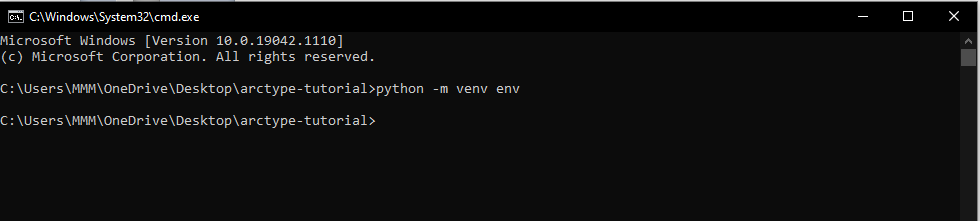
Let's create an isolated virtual environment for this project. Virtual environments help us avoid installing dependencies globally on our system. This helps to make sure that the dependencies of other projects won't be included within the dependencies of our current project, even though they're all on the same local machine. To do that run the following command.
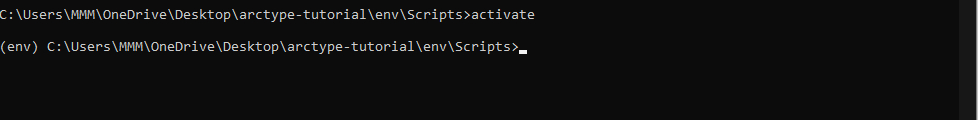
Next, activate the virtual environment by navigating to the base directory of our new virtual environment (in our example, it has the name "env"). Then, navigate into the Scripts folder and run the executable file "activate."
Django Setup
You can install Django Web Framework with pip and then follow these steps.
Create a project
Now, let's create the project. We can do this by running the command django-admin startproject followed by the name of the project (in this case, taskmanagement). The full command should look something like this:
django-admin startproject taskmanagement
Here, we can name the project however we like, but be sure to be descriptive.
Create an app
Let's navigate to the taskmanagement folder and create an application. To do that we use the command python manage.py startapp then the name of the app, which in our case we've named task_management_app.
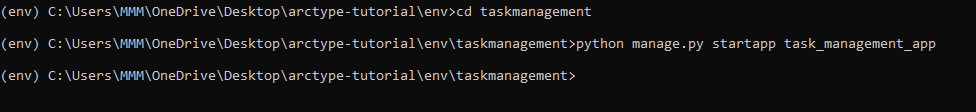
The app is created successfully. We can now open the project in our favorite IDE.
Migrations
In Django, we use migrations to move changes we make to our models (adding a field, deleting a model, etc.) into our database schema. First, we need to make migrations to our database. Run the command python manage.py makemigrations. makemigrations are used to create new migrations based on the changes made to the models in a project. The output is as shown below.
Now let's run our app to see if we have successfully installed and our project properly set up. To do this, we are to change the directory into our project and run the command python manage.py runserver:
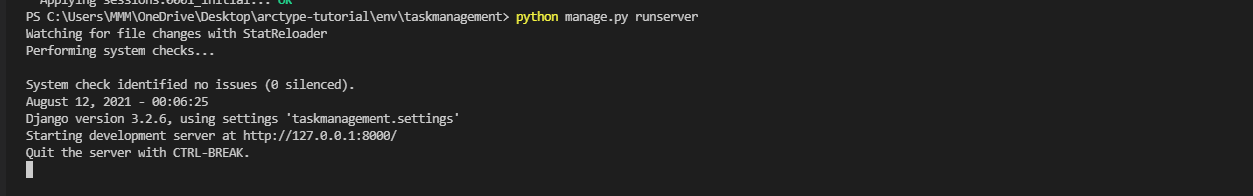
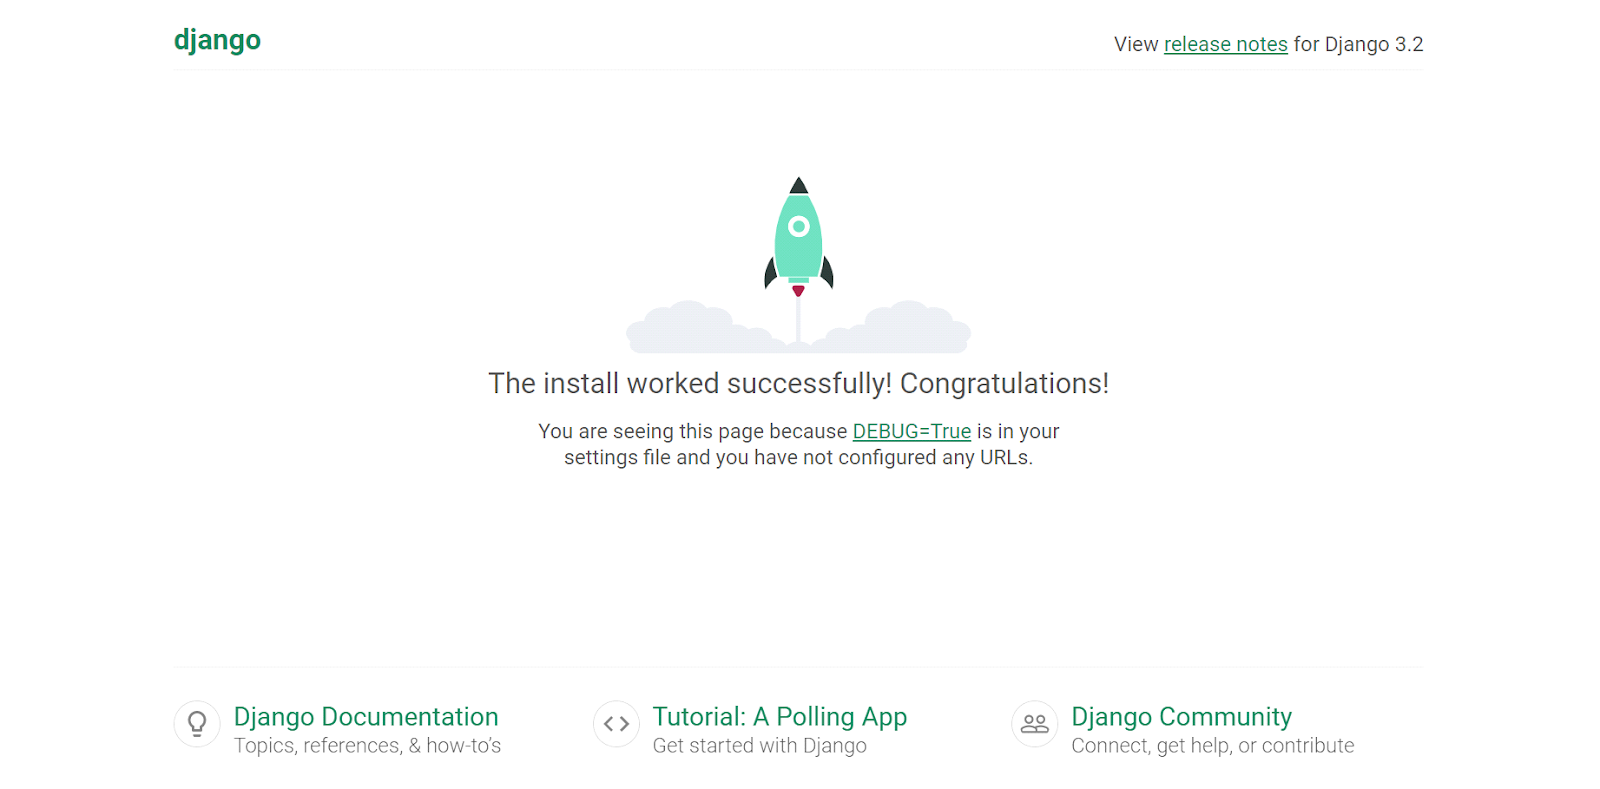
We have started our development server at http://127.0.01:8000/! So we can now open our browser to access our app using this URL. If everything works fine, the screen with the same image below is displayed as the default Django page.
Now we want to make some configurations inside the settings.py file. The primary thing we will do is add the app's name in the installed apps, as seen directly below, and then add the MySQL database to Django.
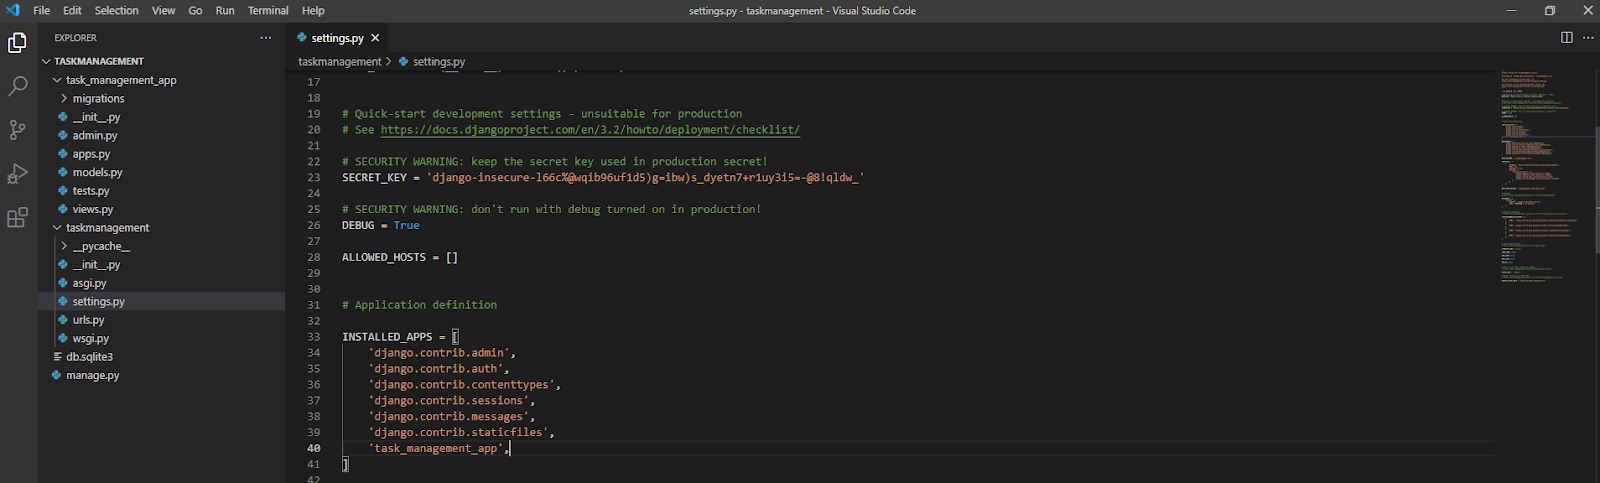
Editing Settings.py to add MySQL to Django
In your settings.py file, edit the code below and replace it with the details required to connect to your SQL server:
DATABASES = {
    'default': {
        'ENGINE': 'django.db.backends.mysql',
        'NAME': 'database_name',
        'HOST': '127.0.0.1',
        'PORT': '3306',
        'USER': 'username',
        'PASSWORD': 'password',
    }
}
Todo list app data model
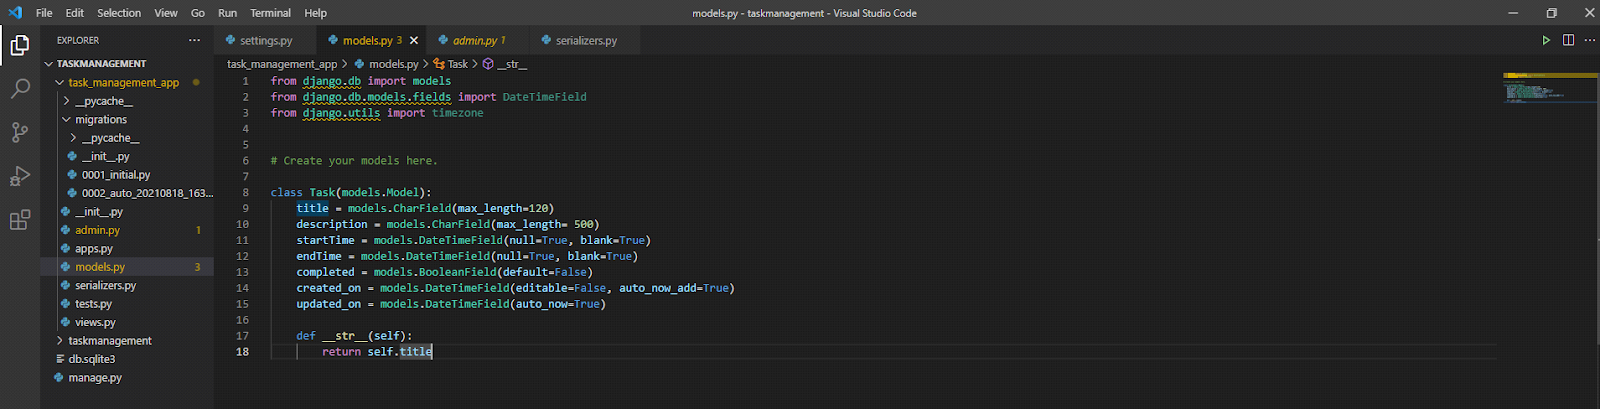
Next, we want to create a model. This model will determine how the task will be stored on the database. The task will have seven properties, a title, a description of the task, a startTime, an endTime, a completed status, and a created on and an updated on column to mark when our task was first created and updated.
Note: our startTime and endTime use the DateTime class. This will hold the date and time in which the task was started and completed respectively. We have set created_on field's auto_now_addproperty to true. This automatically fills this field with the current date and time in which the task was created.
Now let's go ahead and make migrations. Any time changes are made to our models, we need to make migrations. Once that is completed, we will find a new file inside the migrations folder as shown below.
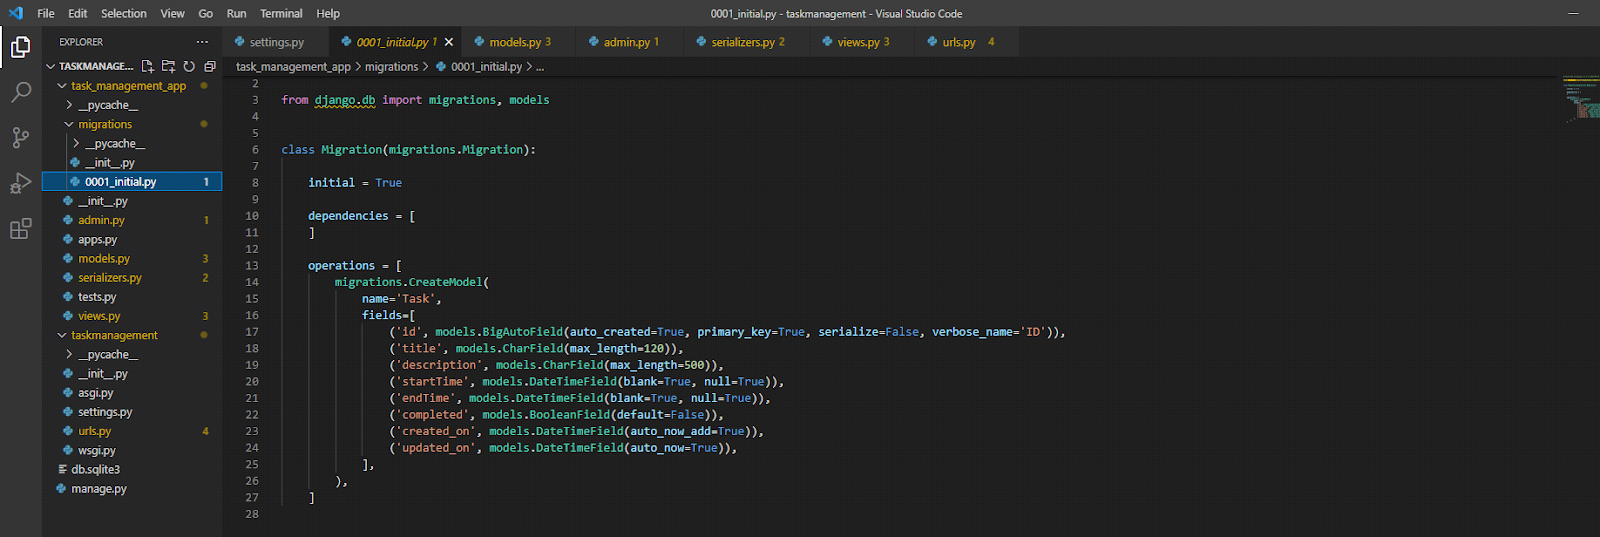
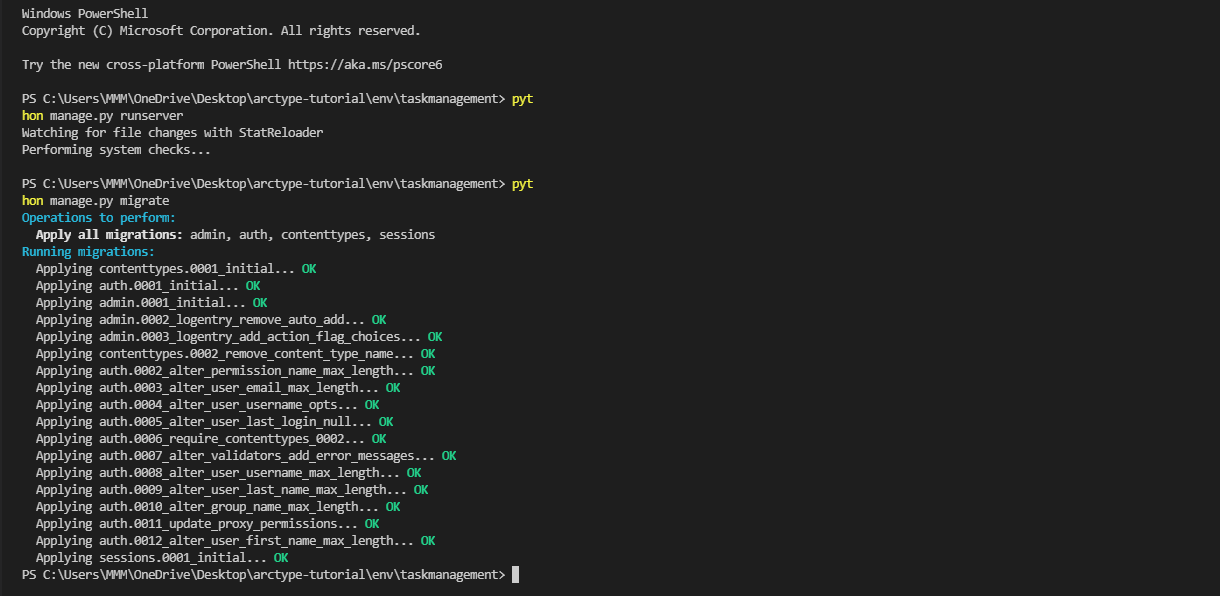
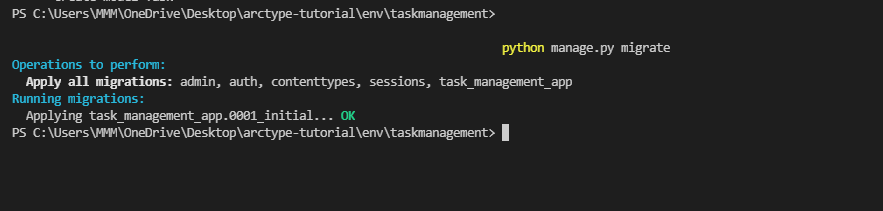
We didn't write this code manually. This is the SQL code that Django has handled for us. Next, we migrate with python manage.py migrate. Migrate is responsible for applying and reapplying migrations.
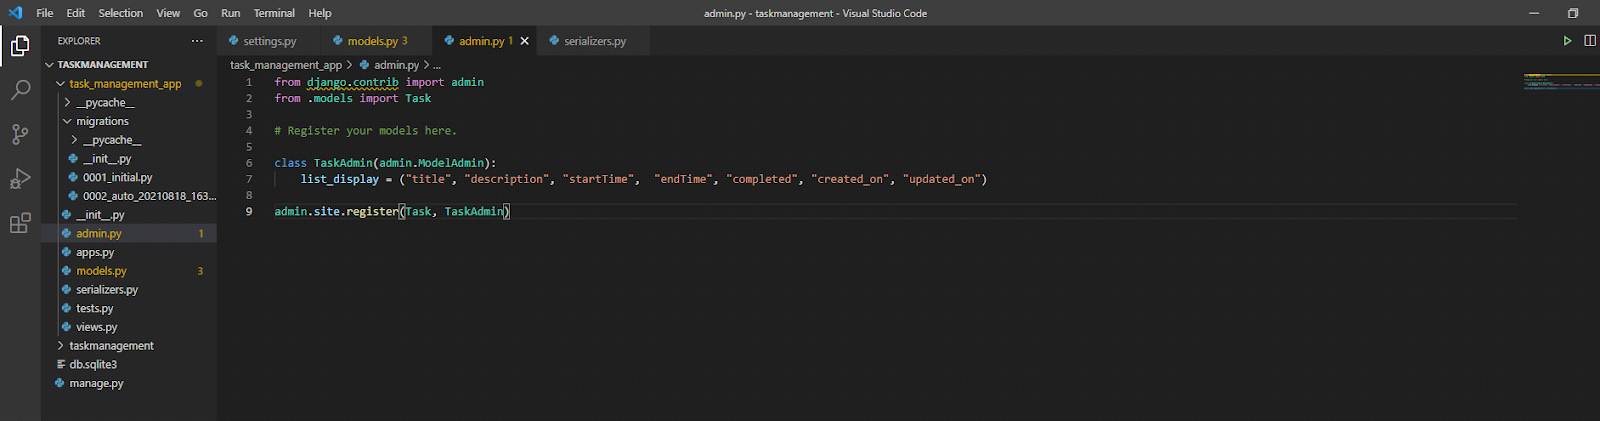
Now we test that the CRUD operation was successful by registering the task on the admin panel as follows:
from django.contrib import admin
from .models import Task

class TaskAdmin(admin.ModelAdmin):
      list_display = ("title", "description", "startTime",  "endTime", "completed", "created_on", "updated_on")

admin.site.register(Task, TaskAdmin)
Task management API
To build the API we will install and use the Django REST Framework.
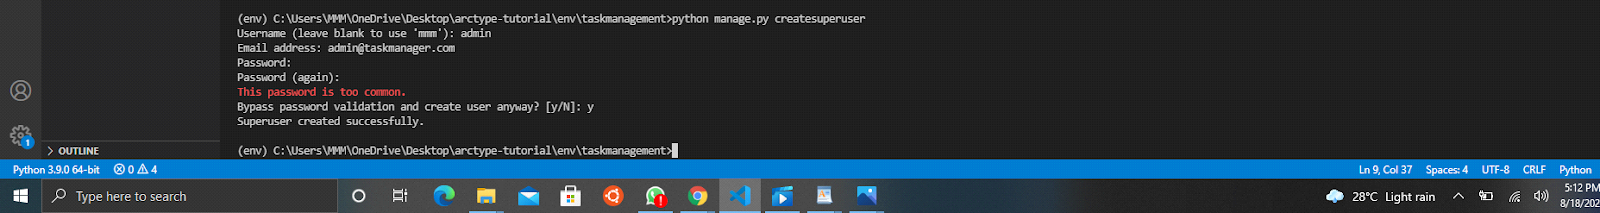
Creating a superuser and adding the rest_framework
Let's create a superuser with the following command: python manage.py createsuperuser
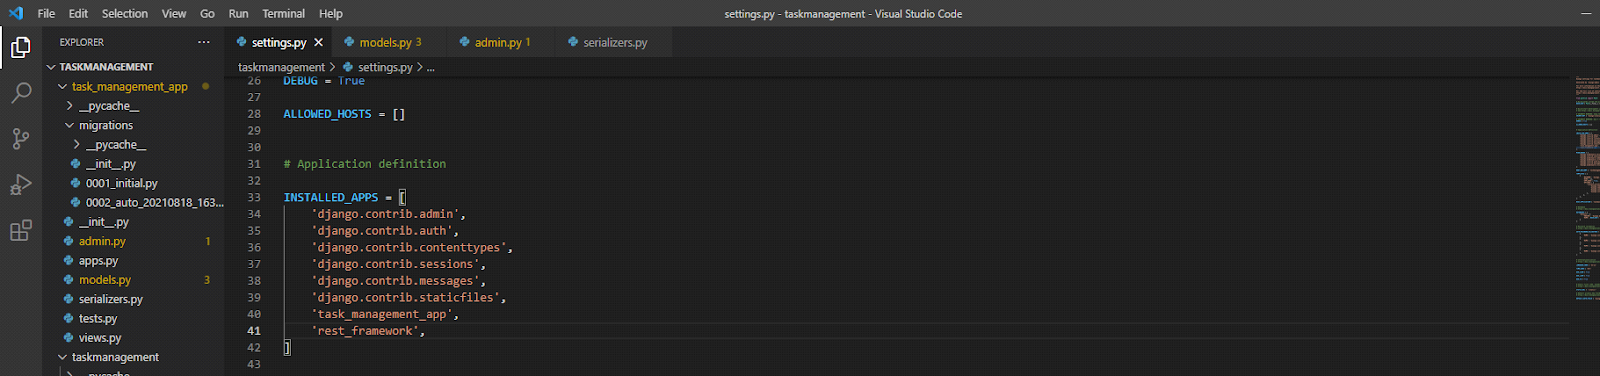
Next, we'll need to add the Django rest_framework to the list of installed apps.
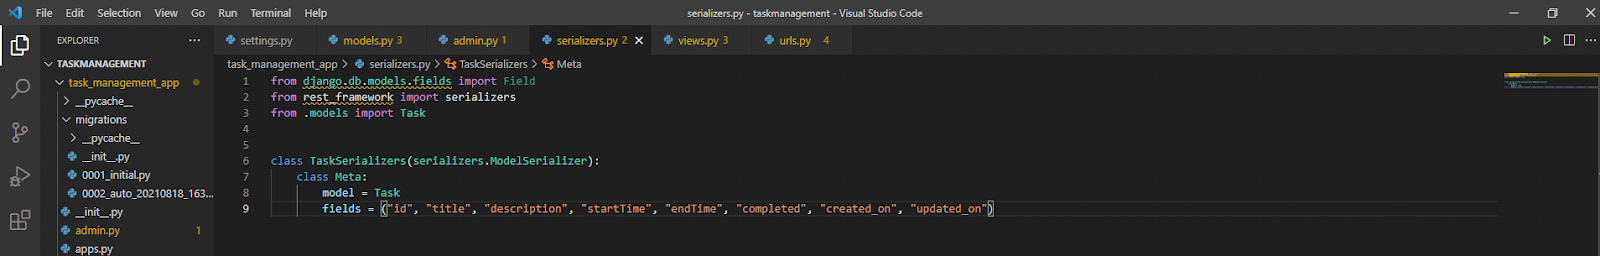
Creating the serializers
JSON stands for JavaScript Object Notation. Serializers convert the model class to JSON so that the frontend can work with the received data.
from django.db.models.fields import Field
from rest_framework import serializers
from .models import Task


class TaskSerializers(serializers.ModelSerializer):
    class Meta:
        model = Task
        fields = ("id", "title", "description", "startTime", "endTime", "completed", "created_on", "updated_on")
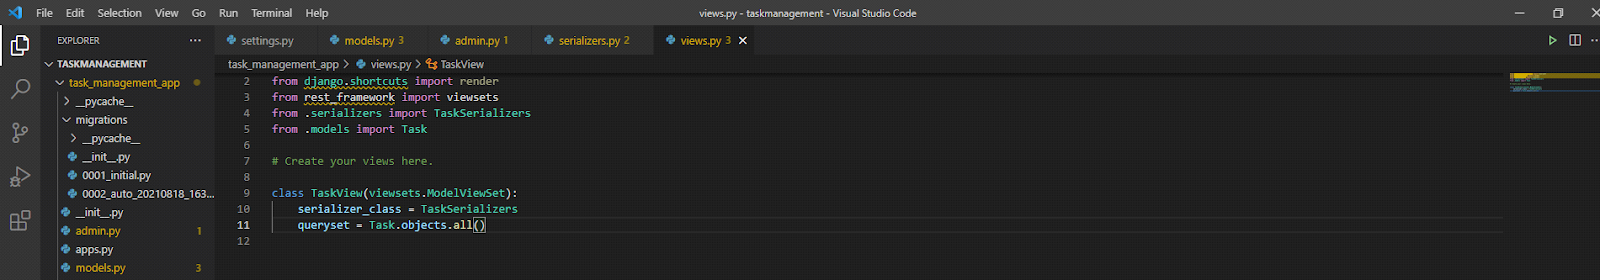
Creating the view
The view is simply a Python function that takes an HTTP request and returns a response. This response may be the HTML contents, for example. The view itself houses the business logic that is necessary to return a response to a client that makes an HTTP call to it.
from django.db.models.query import QuerySet
from django.shortcuts import render
from rest_framework import viewsets
from .serializers import TaskSerializers
from .models import Task

# Create your views here.

class TaskView(viewsets.ModelViewSet):
    serializer_class = TaskSerializers
    queryset = Task.objects.all()
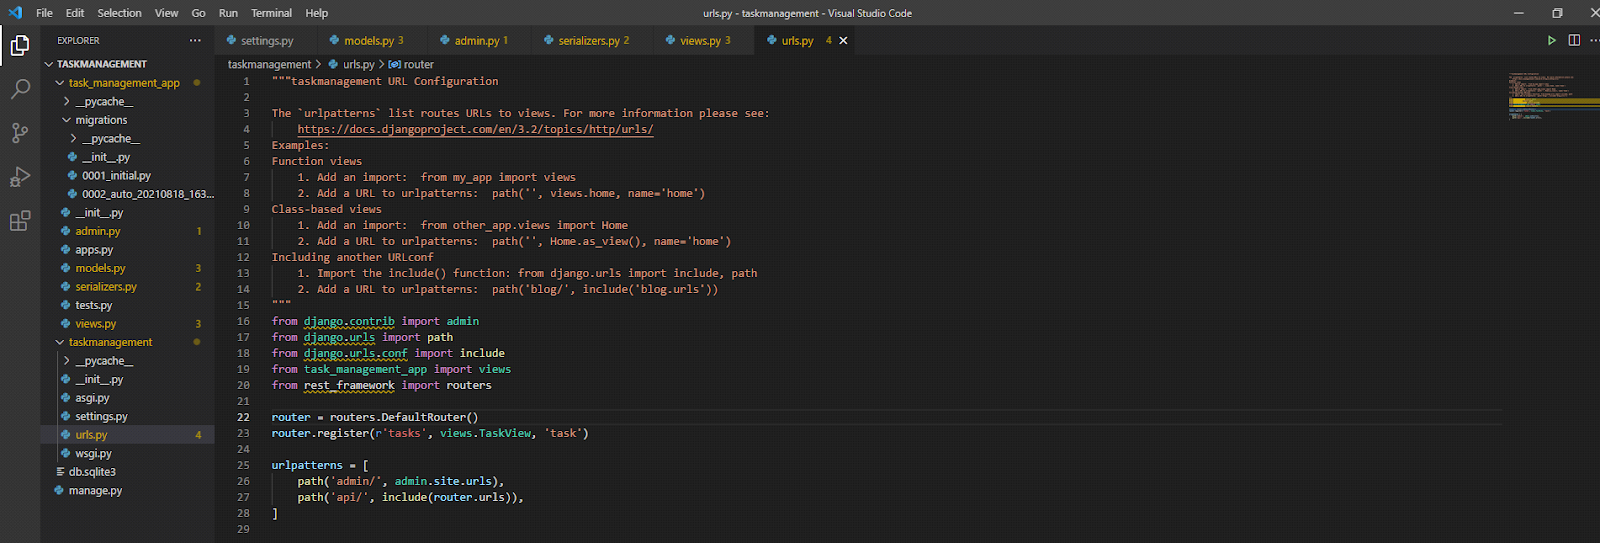
The URL
The URL is used to map path expressions to Python functions (your views). It first receives HTTP requests and routes them to the right matching function in views.py to handle the request. Now let's go to the URL that is in the project folder and add the following code:
from django.contrib import admin
from django.urls import path
from django.urls.conf import include
from task_management_app import views
from rest_framework import routers

router = routers.DefaultRouter()
router.register(r'tasks', views.TaskView, 'task')

urlpatterns = [
    path('admin/', admin.site.urls),
    path('api/', include(router.urls)),
]
Accessing our endpoints
To access our endpoint run your app and visit http://127.0.0.1:8000/api/tasks/ and add a task.
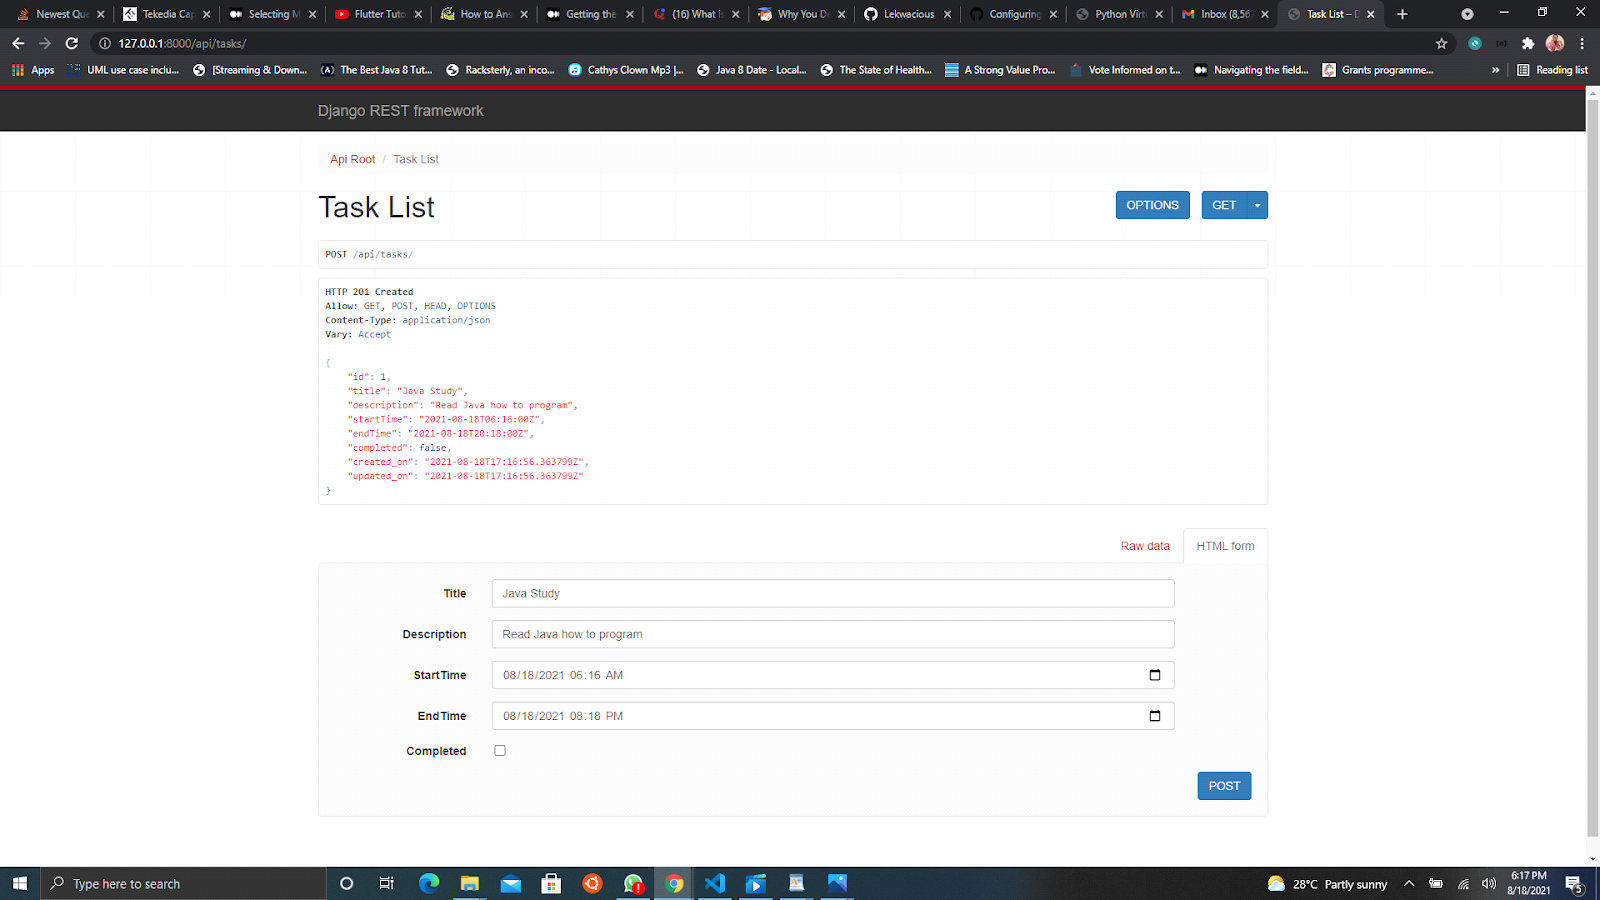
Boom! We have it on our task manager. We can get a particular task by appending the Id of the task to the URL. We can also update or delete a particular task.
This section has taught us how to build a task management app that performs CRUD operations. Now, we will use a SQL client to visualize the data on our database.
Visualize and query task data
Next, we select the SQL type we are most familiar with. In the course of this article, we would be connecting to a MySQL relational database.

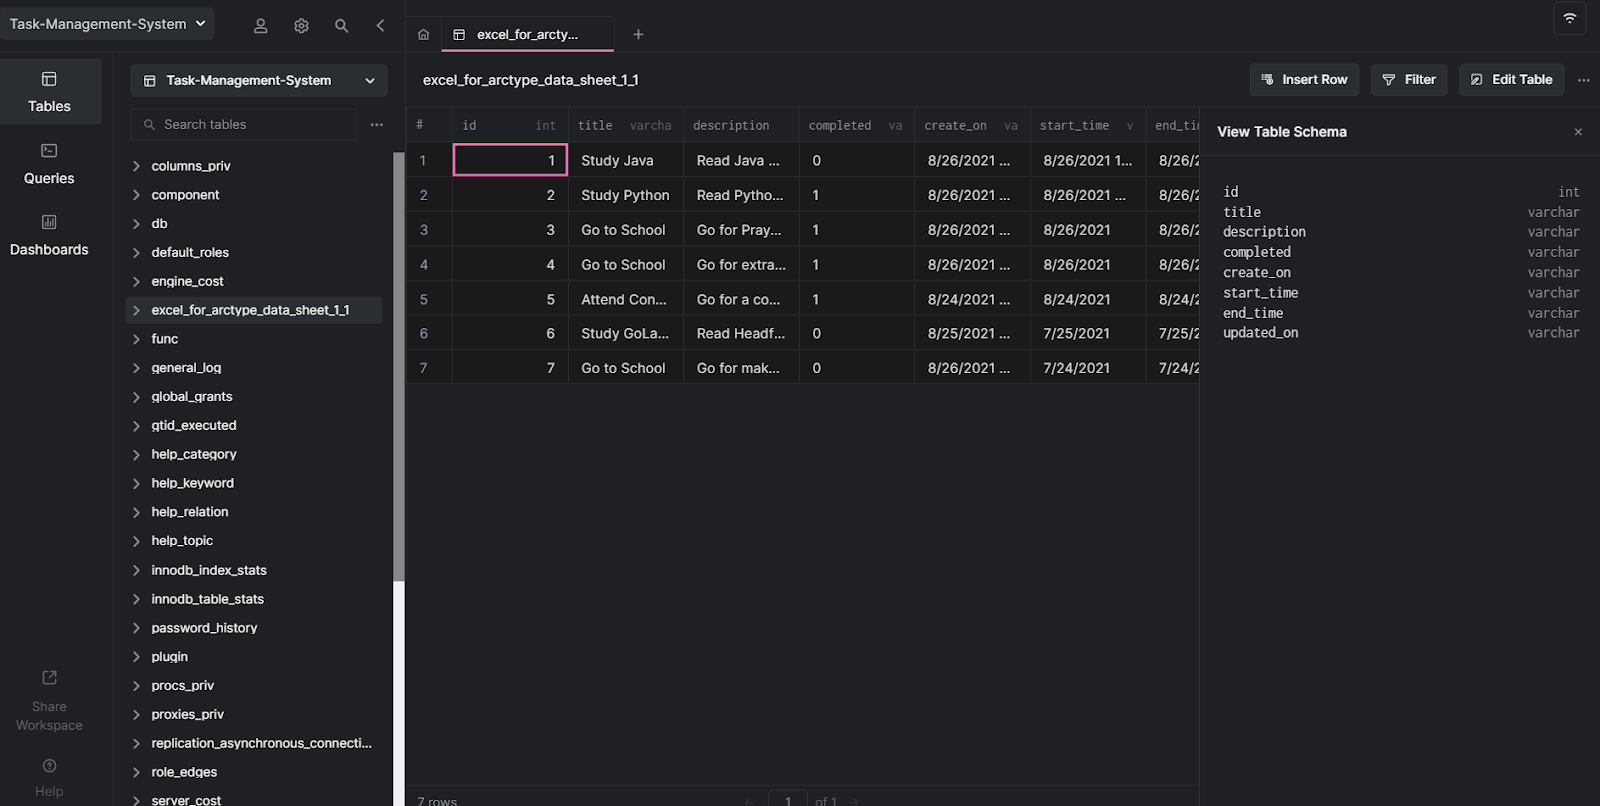
Visualizing tables
I made a sample data .csv for this tutorial. First, I created a Google sheet, exported it to a .csv, and then imported it. This data table contains columns: id, title, description, completed, created on, startTime, endTime, and updated on. This is our exported data set in Table view:
Creating a dashboard to group together activities
Now, we are going to display our list of activities. First, we'll write an SQL query that will display our data set. Click on the Queries tab by the sidebar and select Create query button.
We can start by renaming our query and save it in the editor's heading:
SELECT COUNT(*) AS tables_priv FROM `excel_for_arctype_data_sheet_1_1`;
The result we get should look like the screenshot below:
Next, we can now click on the Dashboard tab to create a new dashboard. Then, we rename our dashboard with our preferred name.
Next, click on "Add tab" and select Chart:
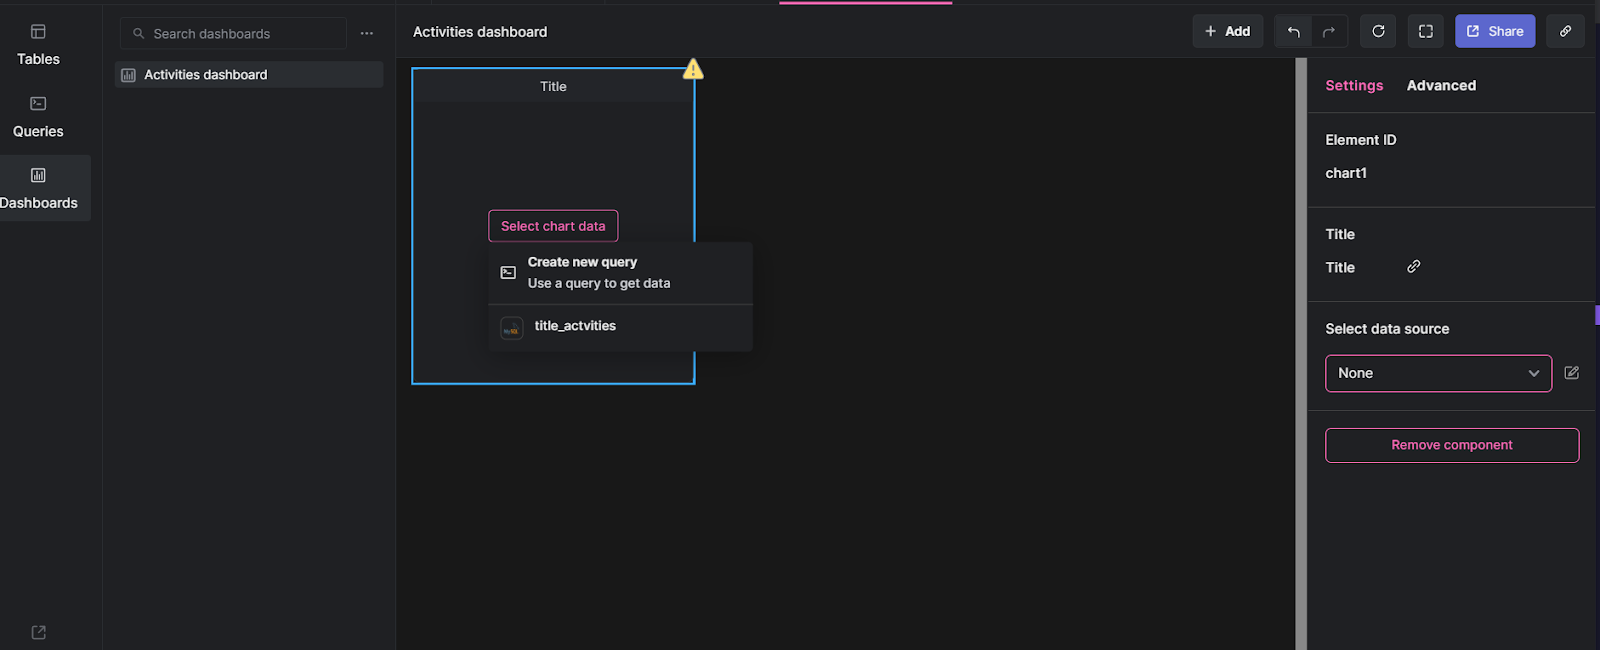
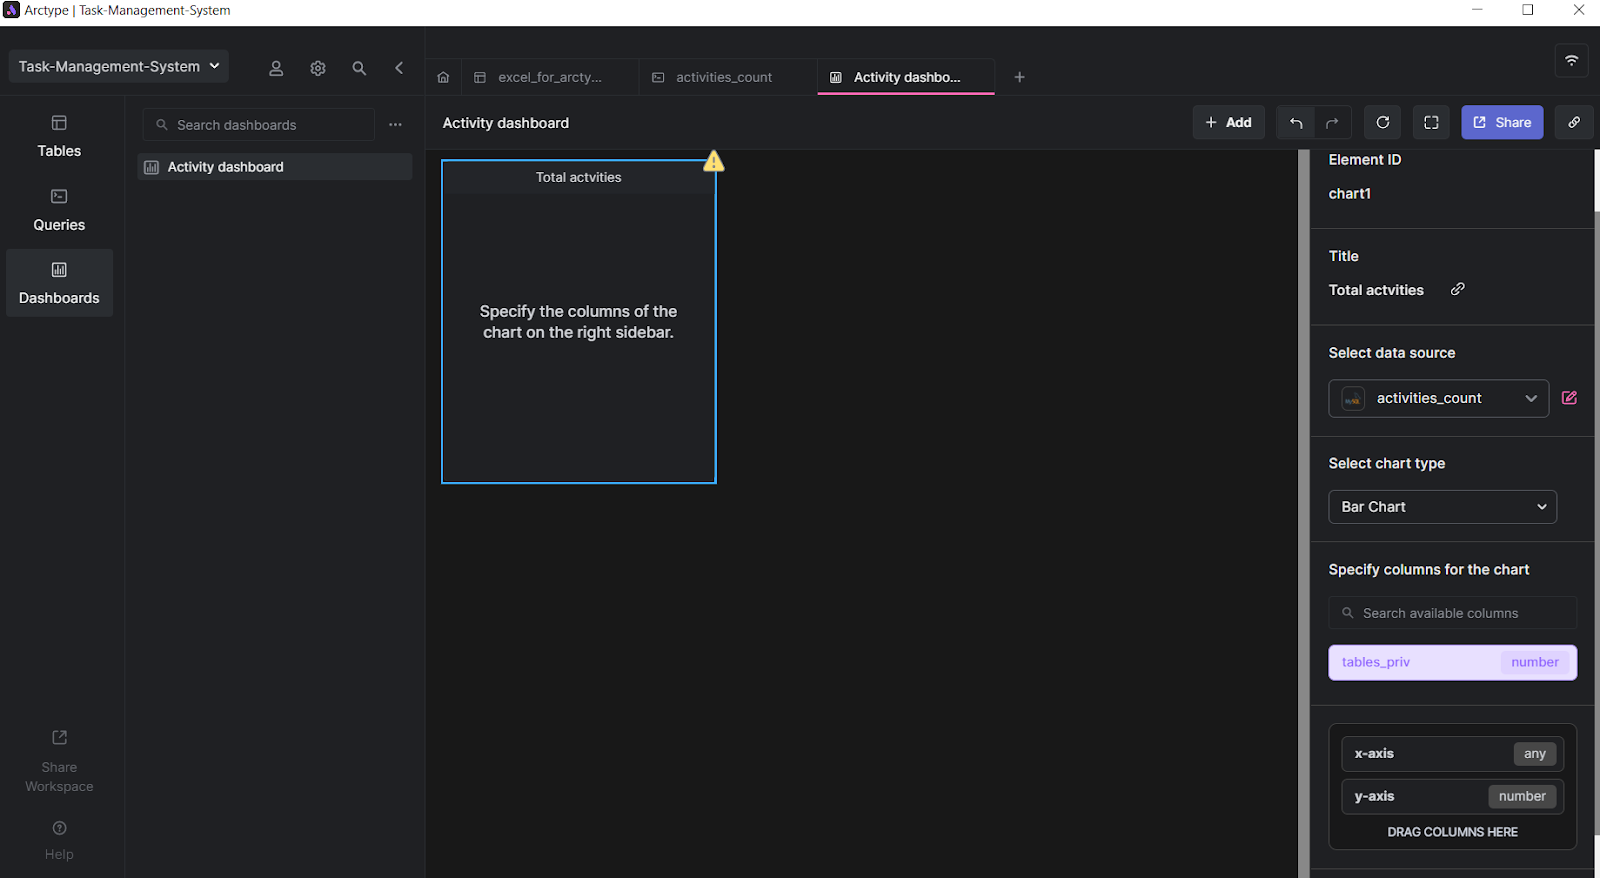
Then, click on the select chart data and select activities_count:
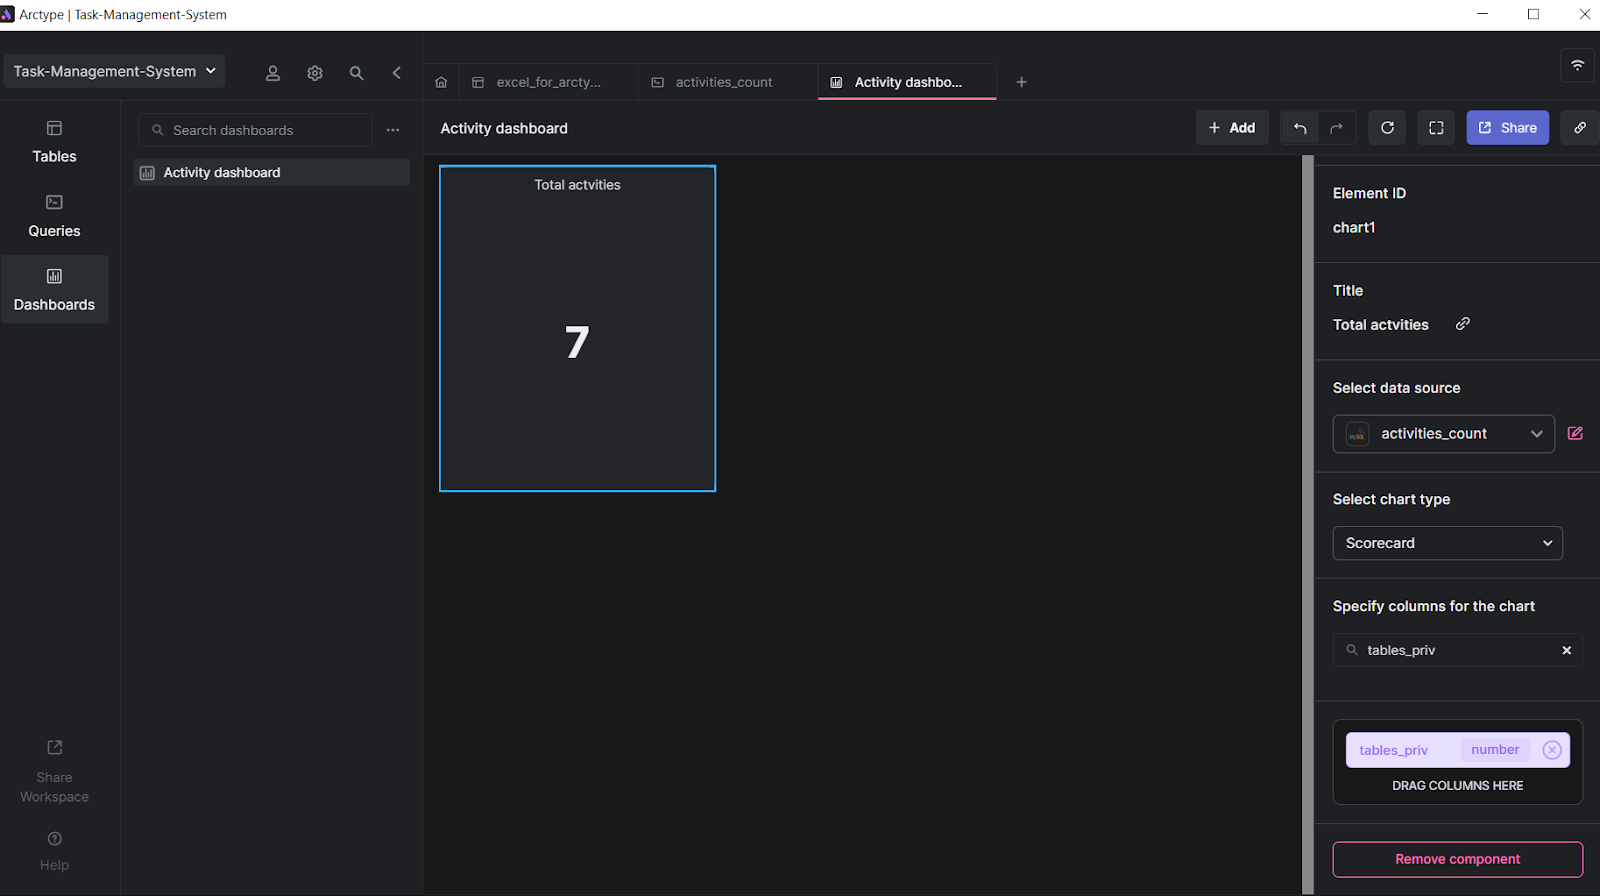
Change the title of the dashboard component and select Score Card as the chart type. Then, we can now drag the table_priv column to be displayed.
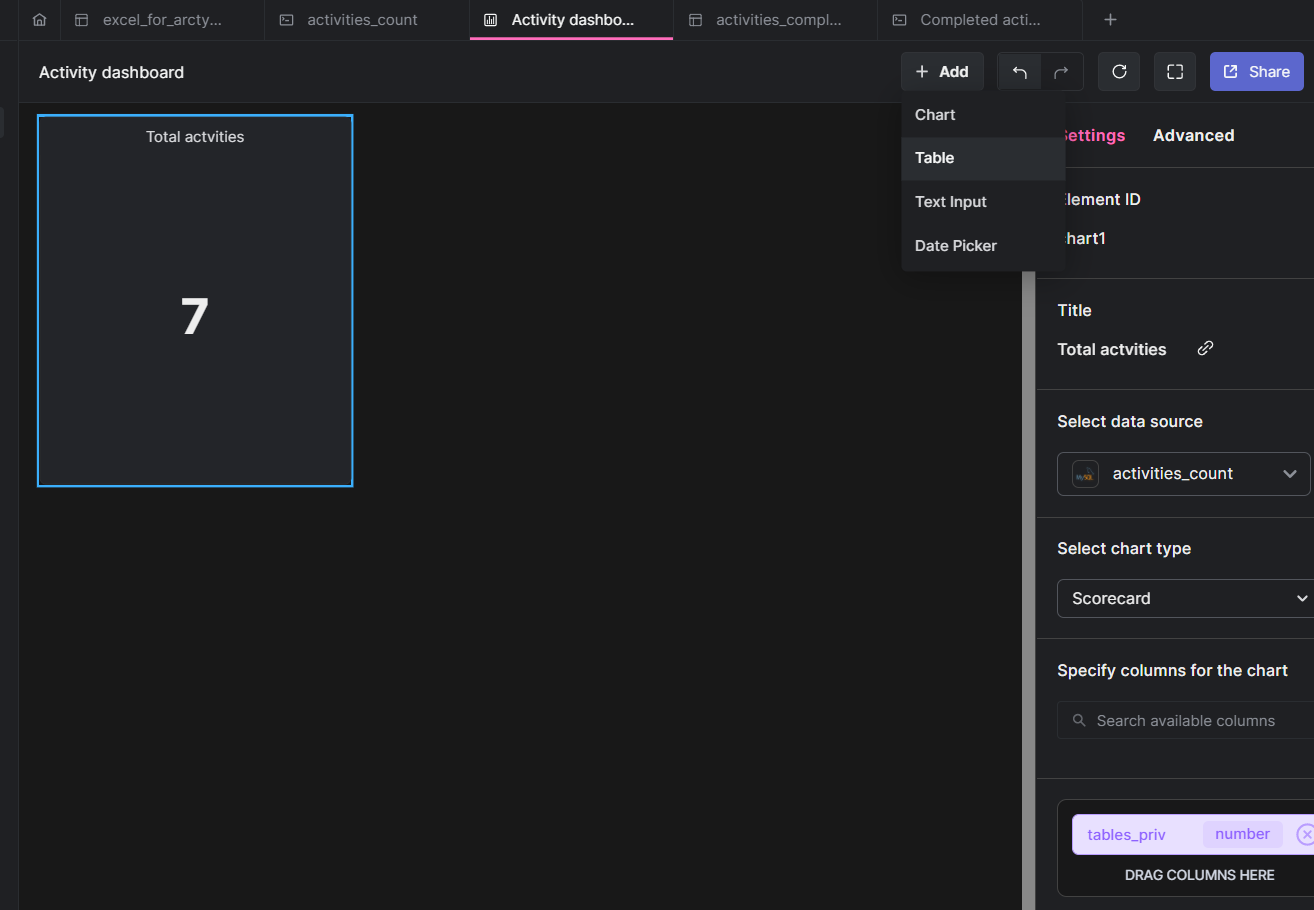
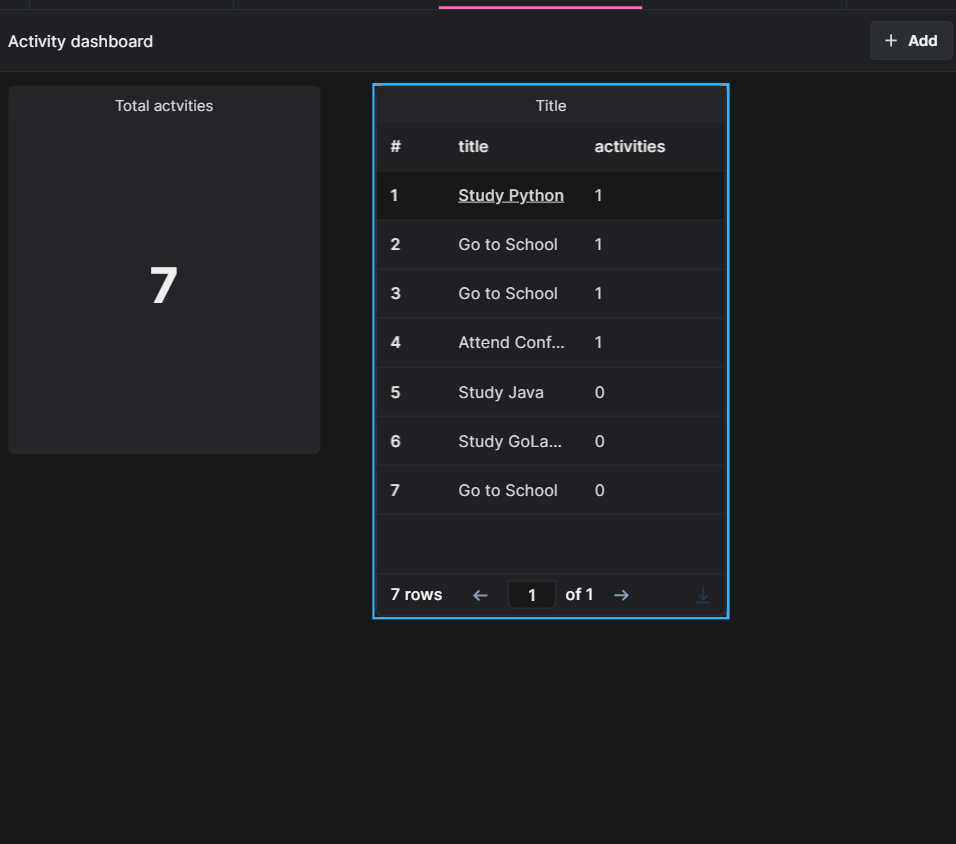
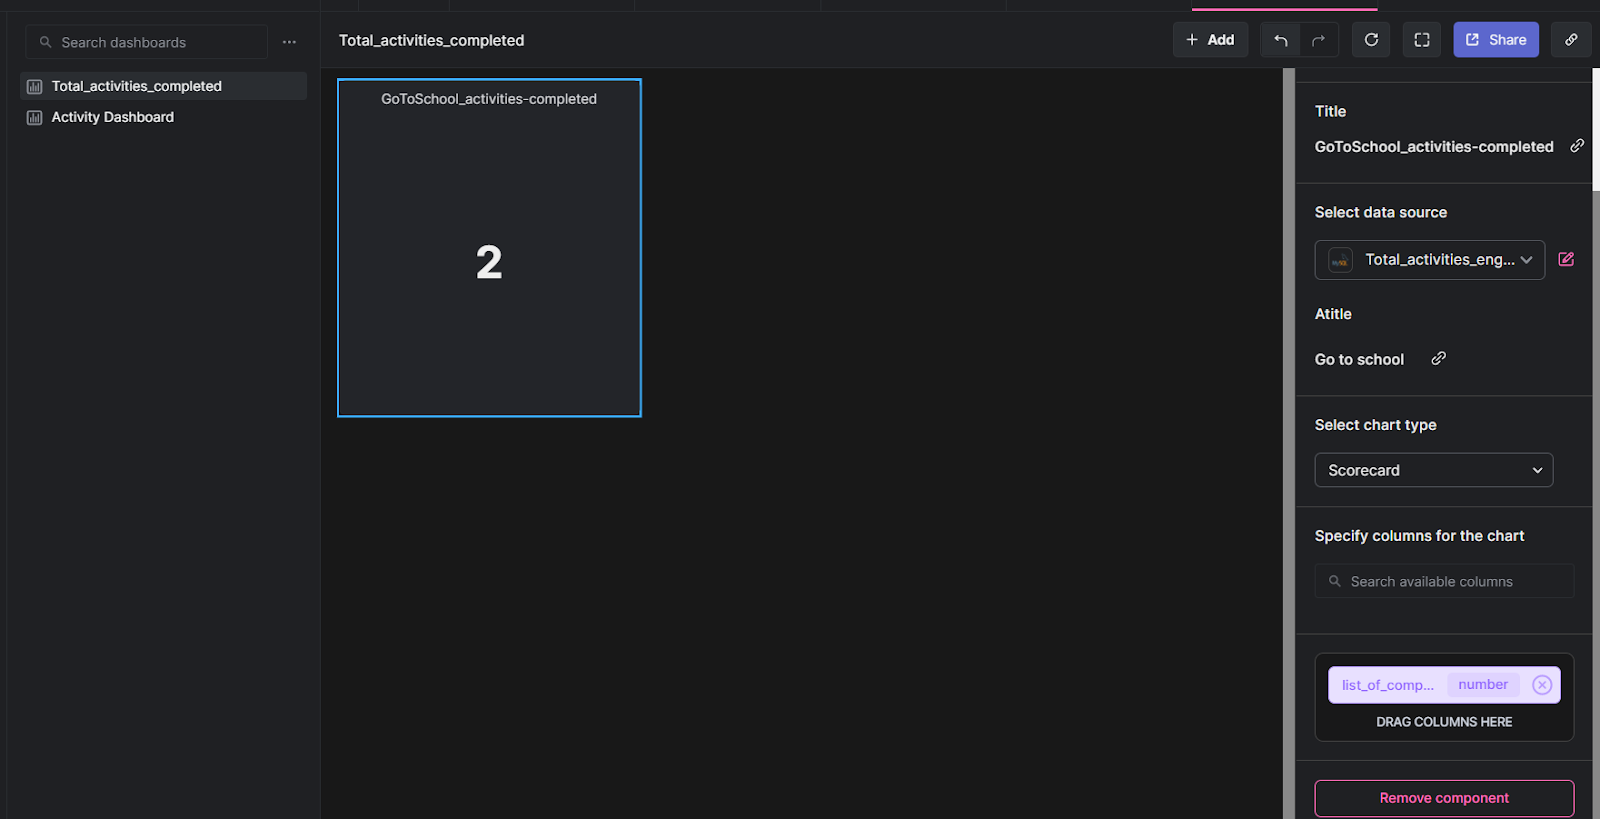
Next, we create a table component to display the activities that were most productive.
Create a new query called activities_complete. We can then carry out the following commands in it:
SELECT
    SUM(completed) AS list_of_completed_activities
FROM
    `excel_for_arctype_data_sheet_1_1`
WHERE
    title = {{Atitle}};

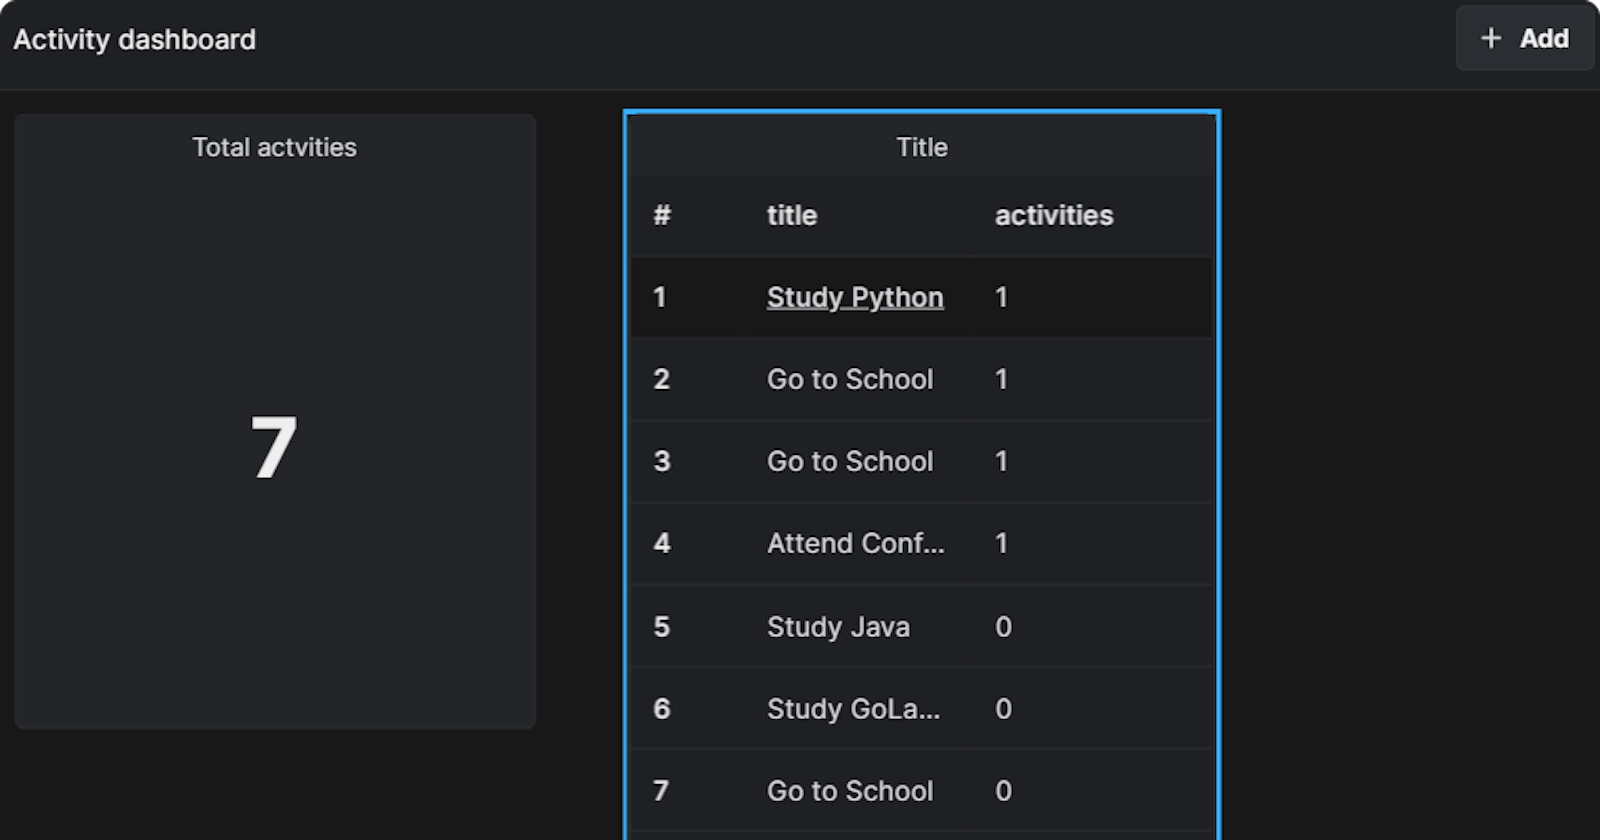
Then, click on the add button from the activity dashboard section we already created and select table:
Lastly, we click on the select chart data button and select the Title query we created earlier.

Creating a pie chart
Here, we are going to create chart components with Arctype to display our datasets in pie charts.
We start the process by using our previous query command. Then, simply select the chart type and change it to Pie Chart and drag the tables_priv to the column category.
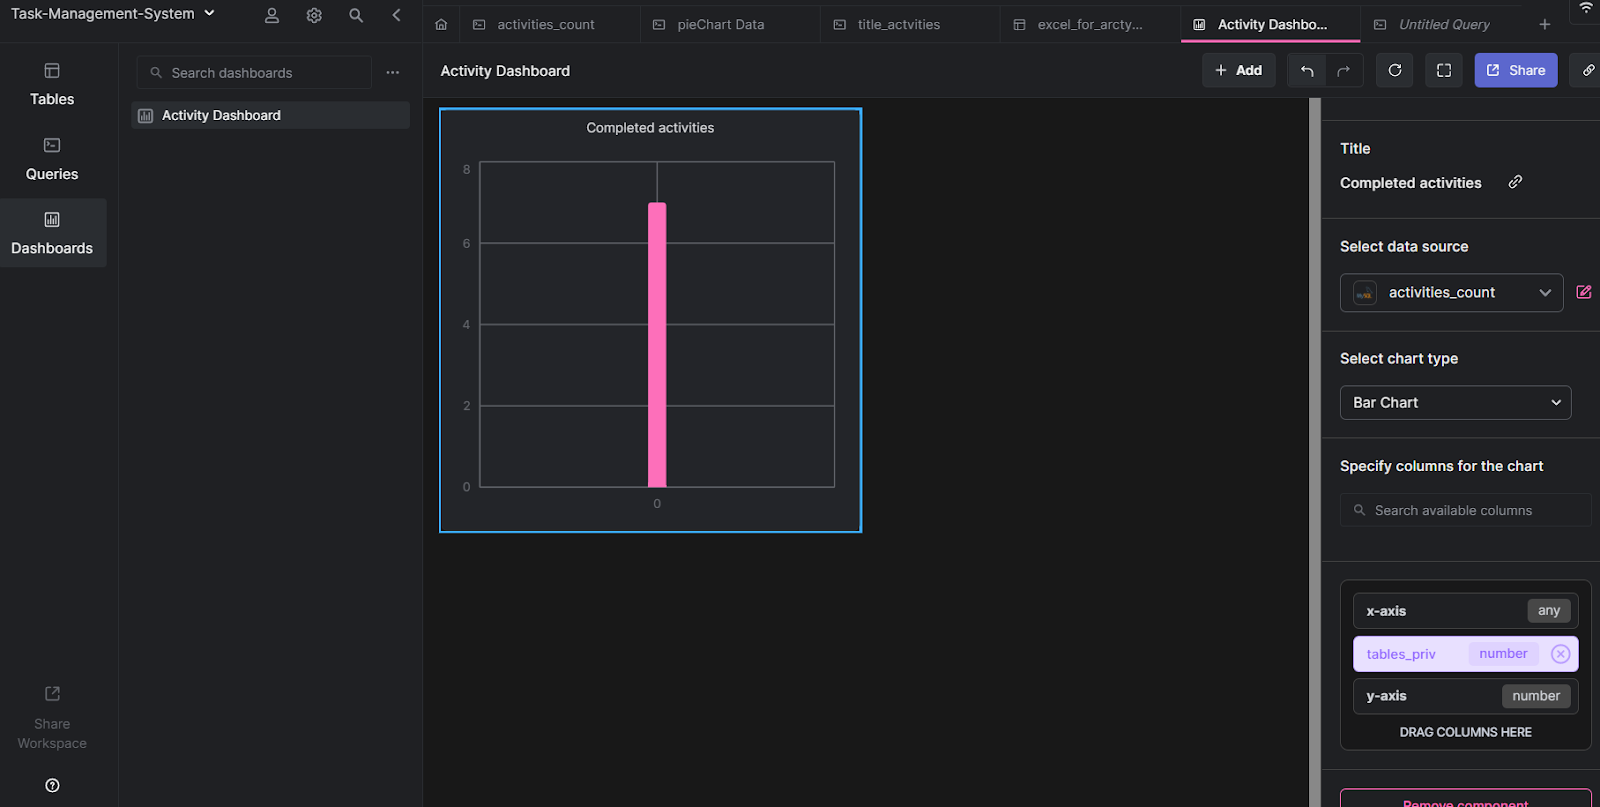
Mixing different types of charts in one dashboard
Here, we are going to create chart components with Arctype to display our datasets in bar charts. We repeat the same process as we did with pie charts.
We change the chart type to Bar Chart and drag tables_priv to the column category. Then, we configure the chart to match whatever settings we want.
Conclusion
This article was divided into two sections. First, we learned how to use a Python framework (Django) to create a task management system. Secondly, we explored the data model of our task management app using a SQL client. While we did that, Arctype to visualize our tables and columns using queries and dashboards. We also learned how to showcase our dataset into pie charts, bar charts, area charts, and line charts.